How to debug a SubQuery project?
May 12, 2025Less than 1 minute
How to debug a SubQuery project?
Video guide
Introduction
In order to debug SubQuery projects such as stepping through code, setting breakpoints, and inspecting variables, you will have to use a Node.js inspector in conjunction with Chrome developer tools.
Node inspector
Run the following command in a terminal screen.
node --inspect-brk <path to subql-node> -f <path to subQuery project>For example:
node --inspect-brk /usr/local/bin/subql-node -f ~/Code/subQuery/projects/subql-helloworld/
Debugger listening on ws://127.0.0.1:9229/56156753-c07d-4bbe-af2d-2c7ff4bcc5ad
For help, see: https://nodejs.org/en/docs/inspector
Debugger attached.
Chrome devtools
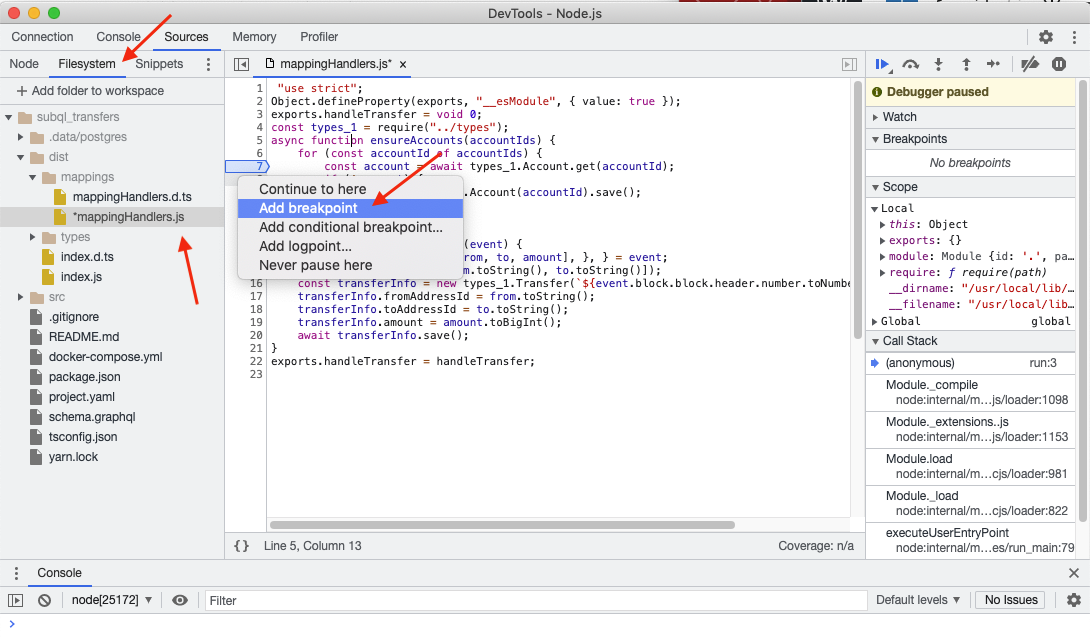
Open up Chrome DevTools and navigate to the Sources tab. Note that clicking on the green icon will open up a new window.

Navigate to Filesystem and add your project folder to the workspace. Then open the dist > mappings folder and select the code you wish to debug. Then step through the code as with any standard debugging tool.