Monitor your SubQuery Project with Prometheus and Grafana
Monitor your SubQuery Project with Prometheus and Grafana
This guide shows you how to pull metrics into Prometheus, an open-source tool for storing, aggregating, and querying time series data. It also shows you how to connect Grafana to Prometheus for flexible data visualisations.
Setting Up Monitoring
Before you begin
Make sure you have started a SubQuery project and have access to the node service running locally. To read how to run a local SubQuery node, review running SubQuery locally.
Step 1. Install Prometheus
First, you need to install Prometheus. You can download the corresponding installation package from the official Prometheus website and follow the official guide on how to install it.
Step 2. Configure Prometheus
Shown below is an example configuration file (prometheus.yml) for a Prometheus server that would connect to a SubQuery project. You'll see that it is set up to scrape the time series metrics of a single, insecure local node every 10 seconds
global:
  scrape_interval: 10s
  evaluation_interval: 10s

scrape_configs:
  - job_name: "my-subql-node"
    metrics_path: "/metrics"
    # Insecure mode:
    scheme: "http"
    # Secure mode:
    # scheme: 'https'
    tls_config:
      insecure_skip_verify: true

    static_configs:
      - targets: ["localhost:3000"]
When you examine the configuration file,:
scrape_interval: 10sdefines the scrape interval.metrics_path: "/metrics"defines the Prometheus-specific subql node endpoint for scraping time series metrics.scheme: "http"specifies that the cluster being scraped is insecure. You should usehttpson remote serverstargets: ["localhost:3000"]specifies the hostname andhttp-portof the subql node to collect time series metrics on. You can change this using the--portcommand on the SubQuery Node (by default it is 3000).
Step 3. Start Prometheus
Start the Prometheus server, with the --config.file flag pointing to the configuration file:
prometheus --config.file=prometheus.ymlStep 4. Install and Start Grafana
You can download & install Grafana from the official website using the official instructions to install Grafana.
Warning
You must change the Grafana web port as the default SubQuery node port is 3000 which conflicts with the default Grafana port. Modify file $WORKING_DIR/conf/defaults.ini (Grafana configuration file location) http_port to 3001 or other.
Step 5. Visualize Metrics in Grafana
Point your browser to http://<hostname of machine running grafana>:3001 and log into the Grafana UI with the default username/password, admin/admin (or create your own account).
You'll then need to add Prometheus as a datasource. You can follow the official guide on how to do this. Please configure the datasource as follows:
| Field | Definition |
|---|---|
| Name | Prometheus |
| Default | True |
| Type | Prometheus |
| URL | http://<hostname of machine running prometheus>:9090 |
| Access | Direct |
Dashboard Templates
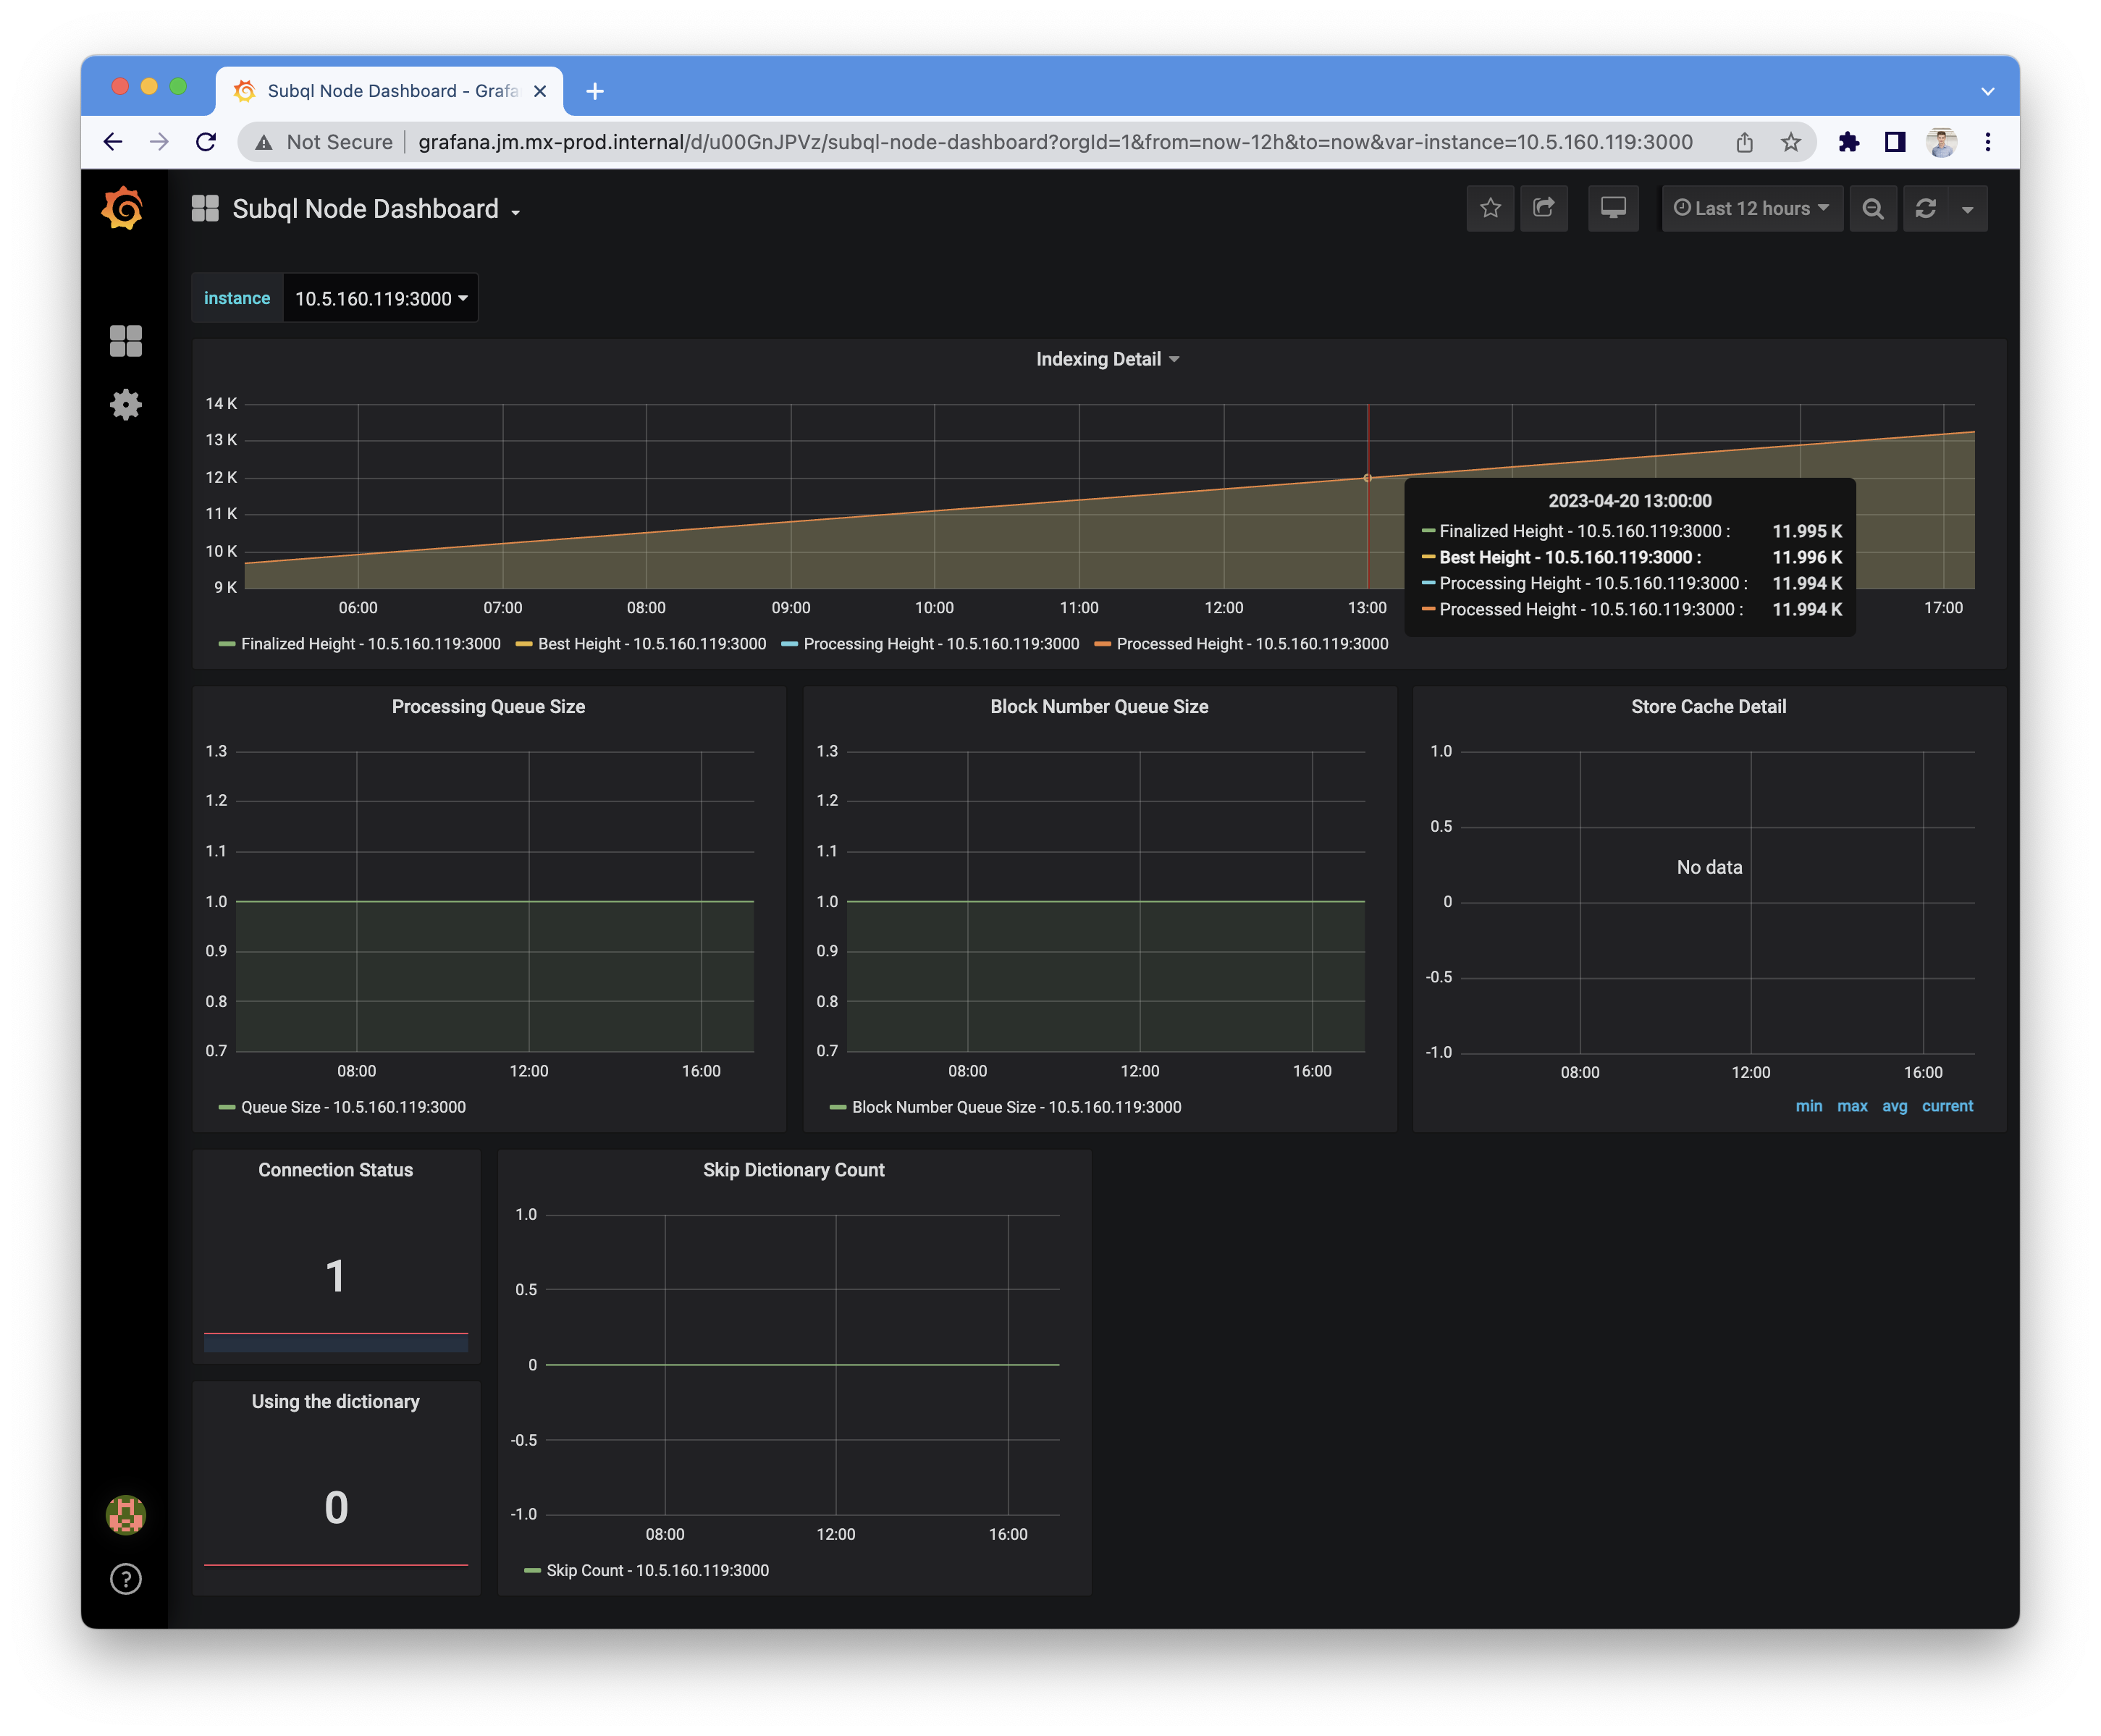
Below is a template dashboard JSON designed for a SubQuery Node that you can import into Grafana.
SubQuery Dashboard JSON
{
"annotations": {
"list": [
{
"builtIn": 1,
"datasource": "-- Grafana --",
"enable": true,
"hide": true,
"iconColor": "rgba(0, 211, 255, 1)",
"name": "Annotations & Alerts",
"type": "dashboard"
}
]
},
"description": "subql node prometheus metrics",
"editable": true,
"gnetId": 11159,
"graphTooltip": 0,
"id": 188,
"iteration": 1681963757430,
"links": [],
"panels": [
{
"aliasColors": {},
"bars": false,
"dashLength": 10,
"dashes": false,
"datasource": "Prometheus",
"fill": 1,
"fillGradient": 0,
"gridPos": {
"h": 6,
"w": 24,
"x": 0,
"y": 0
},
"hiddenSeries": false,
"id": 11,
"legend": {
"alignAsTable": false,
"avg": false,
"current": false,
"max": false,
"min": false,
"rightSide": false,
"show": true,
"total": false,
"values": false
},
"lines": true,
"linewidth": 1,
"links": [],
"nullPointMode": "null",
"options": {
"dataLinks": []
},
"paceLength": 10,
"percentage": false,
"pointradius": 2,
"points": false,
"renderer": "flot",
"seriesOverrides": [],
"spaceLength": 10,
"stack": false,
"steppedLine": false,
"targets": [
{
"expr": "subql_indexer_target_block_height{instance=~\"$instance\"}",
"format": "time_series",
"instant": false,
"intervalFactor": 1,
"legendFormat": "Finalized Height - {{instance}} ",
"refId": "D"
},
{
"expr": "subql_indexer_best_block_height{instance=~\"$instance\"}",
"format": "time_series",
"hide": false,
"instant": false,
"intervalFactor": 1,
"legendFormat": "Best Height - {{instance}} ",
"refId": "A"
},
{
"expr": "subql_indexer_processing_block_height{instance=~\"$instance\"}",
"format": "time_series",
"instant": false,
"intervalFactor": 1,
"legendFormat": "Processing Height - {{instance}} ",
"refId": "B"
},
{
"expr": "subql_indexer_processed_block_count{instance=~\"$instance\"}",
"format": "time_series",
"instant": false,
"intervalFactor": 1,
"legendFormat": "Processed Height - {{instance}} ",
"refId": "C"
}
],
"thresholds": [],
"timeFrom": null,
"timeRegions": [],
"timeShift": null,
"title": "Indexing Detail",
"tooltip": {
"shared": true,
"sort": 0,
"value_type": "individual"
},
"type": "graph",
"xaxis": {
"buckets": null,
"mode": "time",
"name": null,
"show": true,
"values": []
},
"yaxes": [
{
"format": "short",
"label": null,
"logBase": 1,
"max": null,
"min": null,
"show": true
},
{
"format": "short",
"label": null,
"logBase": 1,
"max": null,
"min": null,
"show": true
}
],
"yaxis": {
"align": false,
"alignLevel": null
}
},
{
"aliasColors": {},
"bars": false,
"dashLength": 10,
"dashes": false,
"datasource": "Prometheus",
"fill": 1,
"fillGradient": 0,
"gridPos": {
"h": 8,
"w": 8,
"x": 0,
"y": 6
},
"hiddenSeries": false,
"id": 13,
"legend": {
"alignAsTable": false,
"avg": false,
"current": false,
"max": false,
"min": false,
"rightSide": false,
"show": true,
"total": false,
"values": false
},
"lines": true,
"linewidth": 1,
"links": [],
"nullPointMode": "null",
"options": {
"dataLinks": []
},
"paceLength": 10,
"percentage": false,
"pointradius": 2,
"points": false,
"renderer": "flot",
"seriesOverrides": [],
"spaceLength": 10,
"stack": false,
"steppedLine": false,
"targets": [
{
"expr": "subql_indexer_block_queue_size{instance=~\"$instance\"}",
"format": "time_series",
"intervalFactor": 1,
"legendFormat": "Queue Size - {{instance}} ",
"refId": "A"
}
],
"thresholds": [],
"timeFrom": null,
"timeRegions": [],
"timeShift": null,
"title": "Queue Size",
"tooltip": {
"shared": true,
"sort": 0,
"value_type": "individual"
},
"type": "graph",
"xaxis": {
"buckets": null,
"mode": "time",
"name": null,
"show": true,
"values": []
},
"yaxes": [
{
"format": "short",
"label": null,
"logBase": 1,
"max": null,
"min": null,
"show": true
},
{
"format": "short",
"label": null,
"logBase": 1,
"max": null,
"min": null,
"show": true
}
],
"yaxis": {
"align": false,
"alignLevel": null
}
},
{
"aliasColors": {},
"bars": false,
"dashLength": 10,
"dashes": false,
"datasource": "Prometheus",
"fill": 1,
"fillGradient": 0,
"gridPos": {
"h": 8,
"w": 8,
"x": 8,
"y": 6
},
"hiddenSeries": false,
"id": 14,
"legend": {
"alignAsTable": false,
"avg": false,
"current": false,
"max": false,
"min": false,
"rightSide": false,
"show": true,
"total": false,
"values": false
},
"lines": true,
"linewidth": 1,
"links": [],
"nullPointMode": "null",
"options": {
"dataLinks": []
},
"paceLength": 10,
"percentage": false,
"pointradius": 2,
"points": false,
"renderer": "flot",
"seriesOverrides": [],
"spaceLength": 10,
"stack": false,
"steppedLine": false,
"targets": [
{
"expr": "subql_indexer_blocknumber_queue_size{instance=~\"$instance\"}",
"format": "time_series",
"intervalFactor": 1,
"legendFormat": "Block Number Queue Size - {{instance}} ",
"refId": "A"
}
],
"thresholds": [],
"timeFrom": null,
"timeRegions": [],
"timeShift": null,
"title": "Block Number Queue Size ",
"tooltip": {
"shared": true,
"sort": 0,
"value_type": "individual"
},
"type": "graph",
"xaxis": {
"buckets": null,
"mode": "time",
"name": null,
"show": true,
"values": []
},
"yaxes": [
{
"format": "short",
"label": null,
"logBase": 1,
"max": null,
"min": null,
"show": true
},
{
"format": "short",
"label": null,
"logBase": 1,
"max": null,
"min": null,
"show": true
}
],
"yaxis": {
"align": false,
"alignLevel": null
}
},
{
"aliasColors": {},
"bars": false,
"dashLength": 10,
"dashes": false,
"datasource": "Prometheus",
"fill": 1,
"fillGradient": 0,
"gridPos": {
"h": 8,
"w": 8,
"x": 16,
"y": 6
},
"hiddenSeries": false,
"id": 12,
"legend": {
"alignAsTable": true,
"avg": true,
"current": true,
"max": true,
"min": true,
"rightSide": false,
"show": true,
"total": false,
"values": true
},
"lines": true,
"linewidth": 1,
"links": [],
"nullPointMode": "null",
"options": {
"dataLinks": []
},
"paceLength": 10,
"percentage": false,
"pointradius": 2,
"points": false,
"renderer": "flot",
"seriesOverrides": [],
"spaceLength": 10,
"stack": false,
"steppedLine": false,
"targets": [
{
"expr": "subql_indexer_store_cache_threshold{instance=~\"$instance\"}",
"format": "time_series",
"intervalFactor": 1,
"legendFormat": "Cache Threshold - {{instance}} ",
"refId": "A"
},
{
"expr": "subql_indexer_store_cache_records_size{instance=~\"$instance\"}",
"format": "time_series",
"intervalFactor": 1,
"legendFormat": "Cache Records Size - {{instance}} ",
"refId": "B"
}
],
"thresholds": [],
"timeFrom": null,
"timeRegions": [],
"timeShift": null,
"title": "Store Cache Detail",
"tooltip": {
"shared": true,
"sort": 0,
"value_type": "individual"
},
"type": "graph",
"xaxis": {
"buckets": null,
"mode": "time",
"name": null,
"show": true,
"values": []
},
"yaxes": [
{
"format": "short",
"label": null,
"logBase": 1,
"max": null,
"min": null,
"show": true
},
{
"format": "short",
"label": null,
"logBase": 1,
"max": null,
"min": null,
"show": true
}
],
"yaxis": {
"align": false,
"alignLevel": null
}
},
{
"cacheTimeout": null,
"colorBackground": false,
"colorValue": false,
"colors": ["#299c46", "rgba(237, 129, 40, 0.89)", "#d44a3a"],
"datasource": "Prometheus",
"format": "none",
"gauge": {
"maxValue": 100,
"minValue": 0,
"show": false,
"thresholdLabels": false,
"thresholdMarkers": true
},
"gridPos": {
"h": 4,
"w": 4,
"x": 0,
"y": 14
},
"id": 16,
"interval": null,
"links": [],
"mappingType": 1,
"mappingTypes": [
{
"name": "value to text",
"value": 1
},
{
"name": "range to text",
"value": 2
}
],
"maxDataPoints": 100,
"nullPointMode": "connected",
"nullText": null,
"options": {},
"postfix": "",
"postfixFontSize": "50%",
"prefix": "",
"prefixFontSize": "50%",
"rangeMaps": [
{
"from": "null",
"text": "N/A",
"to": "null"
}
],
"sparkline": {
"fillColor": "rgba(31, 118, 189, 0.18)",
"full": false,
"lineColor": "#F2495C",
"show": true
},
"tableColumn": "",
"targets": [
{
"expr": "subql_indexer_api_connected{instance=~\"$instance\"}",
"format": "time_series",
"intervalFactor": 1,
"legendFormat": "{{instance}}",
"refId": "A"
}
],
"thresholds": "",
"timeFrom": null,
"timeShift": null,
"title": "Connection Status",
"type": "singlestat",
"valueFontSize": "80%",
"valueMaps": [
{
"op": "=",
"text": "N/A",
"value": "null"
}
],
"valueName": "current"
},
{
"aliasColors": {},
"bars": false,
"dashLength": 10,
"dashes": false,
"datasource": "Prometheus",
"fill": 1,
"fillGradient": 0,
"gridPos": {
"h": 8,
"w": 8,
"x": 4,
"y": 14
},
"hiddenSeries": false,
"id": 15,
"legend": {
"alignAsTable": false,
"avg": false,
"current": false,
"max": false,
"min": false,
"rightSide": false,
"show": true,
"total": false,
"values": false
},
"lines": true,
"linewidth": 1,
"links": [],
"nullPointMode": "null",
"options": {
"dataLinks": []
},
"paceLength": 10,
"percentage": false,
"pointradius": 2,
"points": false,
"renderer": "flot",
"seriesOverrides": [],
"spaceLength": 10,
"stack": false,
"steppedLine": false,
"targets": [
{
"expr": "subql_indexer_skip_dictionary_count{instance=~\"$instance\"}",
"format": "time_series",
"intervalFactor": 1,
"legendFormat": "Skip Count - {{instance}} ",
"refId": "A"
}
],
"thresholds": [],
"timeFrom": null,
"timeRegions": [],
"timeShift": null,
"title": "Skip Dictionary Count",
"tooltip": {
"shared": true,
"sort": 0,
"value_type": "individual"
},
"type": "graph",
"xaxis": {
"buckets": null,
"mode": "time",
"name": null,
"show": true,
"values": []
},
"yaxes": [
{
"format": "short",
"label": null,
"logBase": 1,
"max": null,
"min": null,
"show": true
},
{
"format": "short",
"label": null,
"logBase": 1,
"max": null,
"min": null,
"show": true
}
],
"yaxis": {
"align": false,
"alignLevel": null
}
},
{
"cacheTimeout": null,
"colorBackground": false,
"colorValue": false,
"colors": ["#299c46", "rgba(237, 129, 40, 0.89)", "#d44a3a"],
"datasource": "Prometheus",
"format": "none",
"gauge": {
"maxValue": 100,
"minValue": 0,
"show": false,
"thresholdLabels": false,
"thresholdMarkers": true
},
"gridPos": {
"h": 4,
"w": 4,
"x": 0,
"y": 18
},
"id": 4,
"interval": null,
"links": [],
"mappingType": 1,
"mappingTypes": [
{
"name": "value to text",
"value": 1
},
{
"name": "range to text",
"value": 2
}
],
"maxDataPoints": 100,
"nullPointMode": "connected",
"nullText": null,
"options": {},
"postfix": "",
"postfixFontSize": "50%",
"prefix": "",
"prefixFontSize": "50%",
"rangeMaps": [
{
"from": "null",
"text": "N/A",
"to": "null"
}
],
"sparkline": {
"fillColor": "rgba(31, 118, 189, 0.18)",
"full": false,
"lineColor": "#F2495C",
"show": true
},
"tableColumn": "",
"targets": [
{
"expr": "subql_indexer_using_dictionary{instance=~\"$instance\"}",
"format": "time_series",
"intervalFactor": 1,
"legendFormat": "{{instance}}",
"refId": "A"
}
],
"thresholds": "",
"timeFrom": null,
"timeShift": null,
"title": "Using the dictionary",
"type": "singlestat",
"valueFontSize": "80%",
"valueMaps": [
{
"op": "=",
"text": "N/A",
"value": "null"
}
],
"valueName": "current"
}
],
"refresh": false,
"schemaVersion": 21,
"style": "dark",
"tags": ["subql"],
"templating": {
"list": [
{
"allValue": null,
"current": {
"tags": [],
"text": "All",
"value": ["$__all"]
},
"datasource": "Prometheus",
"definition": "label_values(subql_indexer_best_block_height, instance)",
"hide": 0,
"includeAll": true,
"label": "instance",
"multi": true,
"name": "instance",
"options": [],
"query": "label_values(subql_indexer_best_block_height, instance)",
"refresh": 1,
"regex": "",
"skipUrlSync": false,
"sort": 1,
"tagValuesQuery": "",
"tags": [],
"tagsQuery": "",
"type": "query",
"useTags": false
}
]
},
"time": {
"from": "now-24h",
"to": "now"
},
"timepicker": {
"refresh_intervals": [
"5s",
"10s",
"30s",
"1m",
"5m",
"15m",
"30m",
"1h",
"2h",
"1d"
],
"time_options": ["5m", "15m", "1h", "6h", "12h", "24h", "2d", "7d", "30d"]
},
"timezone": "",
"title": "Subql Node Dashboard",
"uid": "u00GnJPVz",
"version": 4
}SubQuery Node exposes pure NodeJS Metrics. You can use this NodeJS Application Dashbaord to monitor key NodeJS indicators.
Metrics
| Metric | Description |
|---|---|
subql_indexer_api_connected | If the indexer is connected to RPC API endpoint and the connection is healthy (represented as a numerical boolean with 1=true and 0=false) |
subql_indexer_processed_block_count | The number of blocks that have been processed by your SubQuery project |
subql_indexer_processing_block_height | The current processing block height |
subql_indexer_target_block_height | The latest finalized block height on the chain (retrieved via the RPC API endpoint) |
subql_indexer_best_block_height | The latest best block height (for networks other than Cosmos or Algorand) |
subql_indexer_block_queue_size | The count of blocks waiting to be processed in the fetched block queue |
subql_indexer_blocknumber_queue_size | The count of blocks waiting to be fetched from the RPC API endpoint |
subql_indexer_using_dictionary | If the indexer is connected and using a SubQuery Dictionary (represented as a numerical boolean with 1=true and 0=false) |
subql_indexer_skip_dictionary_count | The number of times indexer has skipped using the dictionary. This may be due to a dictionary endpoint error, or because your project is indexed at a higher block height than the dictionary |
subql_indexer_store_cache_threshold | Store cache will flush once the cache record size exceeds this threshold |
subql_indexer_store_cache_records_size | Number of blocks currently in the store cache (that haven't been flushed) |