How to Become a Node Operator
How to Become a Node Operator
Introduction
Welcome to this guide on how to become a Node Operator.
Node Operators can run either data indexing projects or RPC endpoints for the network (or both). At a high level, a Node Operator will run Node Operator Service, and then the various services for the projects they index or endpoints they serve.
Let's take an overview of the basic steps involved in the process:
| Steps | Process Flow |
|---|---|
| Step 1 | Setup & Start your Node Operator services locally in Docker or on an external VM |
| Step 2 | Setup Proxy Endpoint to public |
| Step 3 | Register yourself as a Node Operator to the Network |
| Step 4 | Index a project or sync an RPC endpoint |
| Step 5 | Create a Plan from a Plan Template |
| Step 6 | Set a Node Operator Commission Rate |
| Step 7 | Allocate your SQT to start receiving rewards |
| Step 8 | Troubleshooting and FAQs |
| Step 9 | Optional: Setting up a Grafana Dashboard |
| Step 10 | Automate Docker Compose upgrades |
1. Deploy Node Operator Services
For those who are new to SubQuery, it is recommended to try running the Node Operator Service on your local machine first. For intermediate to advanced users, it is recommended to set up a VM on AWS (or similar) to host your Node Operator service. It does not need to be on the same VM as your data indexer or RPC endpoint (in fact we suggest that you run it seperately).
Recommend resources for the machine
| Category | vCPU | RAM | Storage |
|---|---|---|---|
| indexer_db | 2 | 2G | -- |
| subql_node (per project) | 2 | 2G | 400G |
| indexer_proxy | 2 | 1G | -- |
Select the appropriate link to follow the guide to setup a Node Operator:
Please return here after following these guides.
Port configurations
Here are the recommended port configurations for running a Node Operator service:
- Port
8000 / TCP: This port should be configured to only allow access from your own IP address, used byindexer_coordinator. - Port
7370 / UDP: This port can be opened to the public and used for broadcasting data to multiple clients or nodes in a peer-to-peer network, used byindexer_proxy. - Port
80 / HTTP: This port can be opened to the public and used byindexer_proxy.
It's important to ensure that these ports are properly configured and secured to prevent any unauthorised access or security breaches.
Docker
Note that you will need to install Docker and some command tools, and then obtain the docker-compose.yml file.
Running Node Operator Services
Important: Login to your VM and create a folder, such as subquery-indexer
- Run
cd subquery-indexer - Run the follow cmd to download the latest
docker-compose.yml:
curl https://raw.githubusercontent.com/subquery/network-indexer-services/main/deploy/docker-compose.yml -o docker-compose.ymlThis will overwrite the existing docker-compose.yml file. Always use the latest versions (use pre-release versions at your own risk).
| Service | Version Tag |
|---|---|
| subquerynetwork/indexer-coordinator | v2.8.3 |
| subquerynetwork/indexer-proxy | v2.8.1 |
Important
Please go through the docker-compose file carefully, and change the following parameters to your own values:
- Your
POSTGRES_PASSWORDunder your postgres container, as well as--postgres-passwordunder coordinator container. - Your
--secret-keyunder both coordinator and proxy containers. - Your
--jwt-secretand--metrics-tokenunder proxy container.
Pay attention to the versions of indexer-coordinator and indexer-proxy, you should use the latest version. Older versions may experience errors or not generate rewards!
2. Setup Proxy Endpoint to public
After running the docker-compose, you can access proxy endpoint via http://localhost/healthy. You need to make this endpoint publicaly accessible, we will use Nginx to do this.
- Download Nginx:
sudo apt-get install nginx - Create a Nginx config:
mkdir nginx && touch $_/nginx.conf - Update
nginx/nginx.confto add a reverse proxy to our proxy endpoint.
server {
    listen 80;
    location / {
        proxy_pass http://localhost/; # The proxy endpoint.
    }
}- Copy to
conf.d:sudo cp nginx/nginx.conf /etc/nginx/conf.d/ - Start Nginx:
sudo systemctl start nginxorsudo systemctl reload nginx - Test via
curl http://your_ip_or_domain.
We highly recommend setting up SSL on your new server and consulting our security guide carefully. You may be penalised for not setting up SSL, firewalls, or following our security guidelines.
3. Register in the Node Operator Admin App
Once your Indexing Service is all set and running successfully, you should open the Node Operator Admin App and follow the steps to register yourself (usually this is http://localhost:8000/ depending on your installation). This includes:
- Connect your wallet
- Register and stake your minimum required stake (see the current value)
- Add metadata information for your Node Operator account
We suggest you also setup your Social Profile so Delegators can get to know you, and so you can show social credibility. To setup social credibility, create an ENS domain name and profile linked to your wallet. You can setup an ENS domain here.
4. Index or Sync a Project
Node Operators can run either data indexing projects or RPC endpoints for the network (or both).
- To index a data indexing project, please follow the instructions here.
- To connect an RPC endpoint, please follow the instructions here.
5. Create a Plan from a Plan Template
For the initial stages of Mainnet, the SubQuery Council will set some default plan templates to make plan management and creation easier. As a result, plan creation is very easy and just requires to you enter a price. See the guide here.
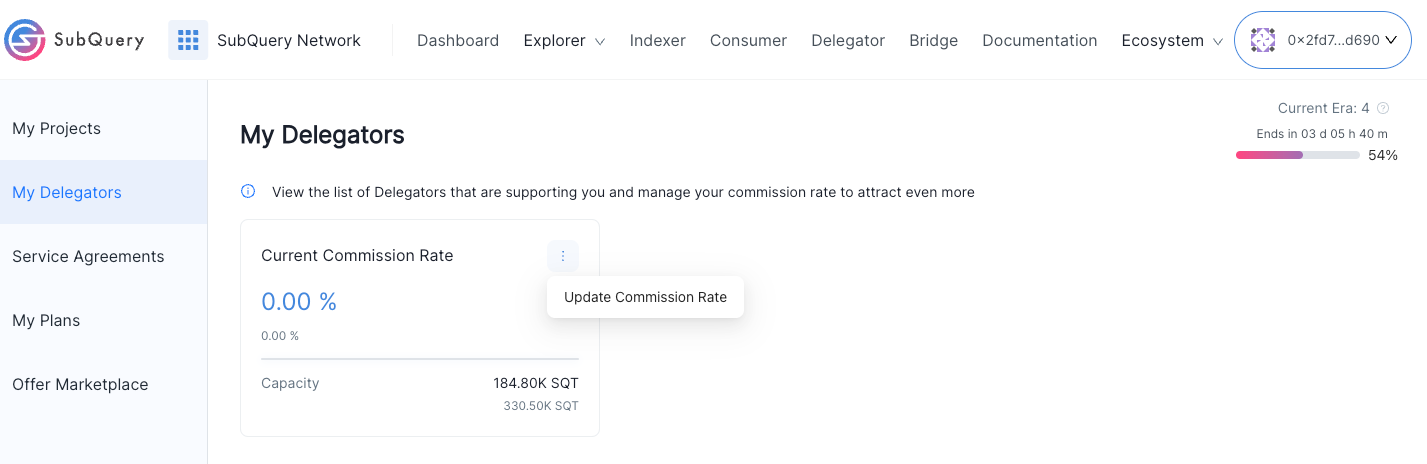
6. Configure a Node Operator Commission Rate (NOCR)
Please update your Node Operator Commission Rate (NOCR) in order to attract more Delegators. You can read more about this here. You can do this by viewing your Node Operator Delegators page, and you can change it by clicking Change commission rate
Enter a new value (in a percent) and submit via your wallet.
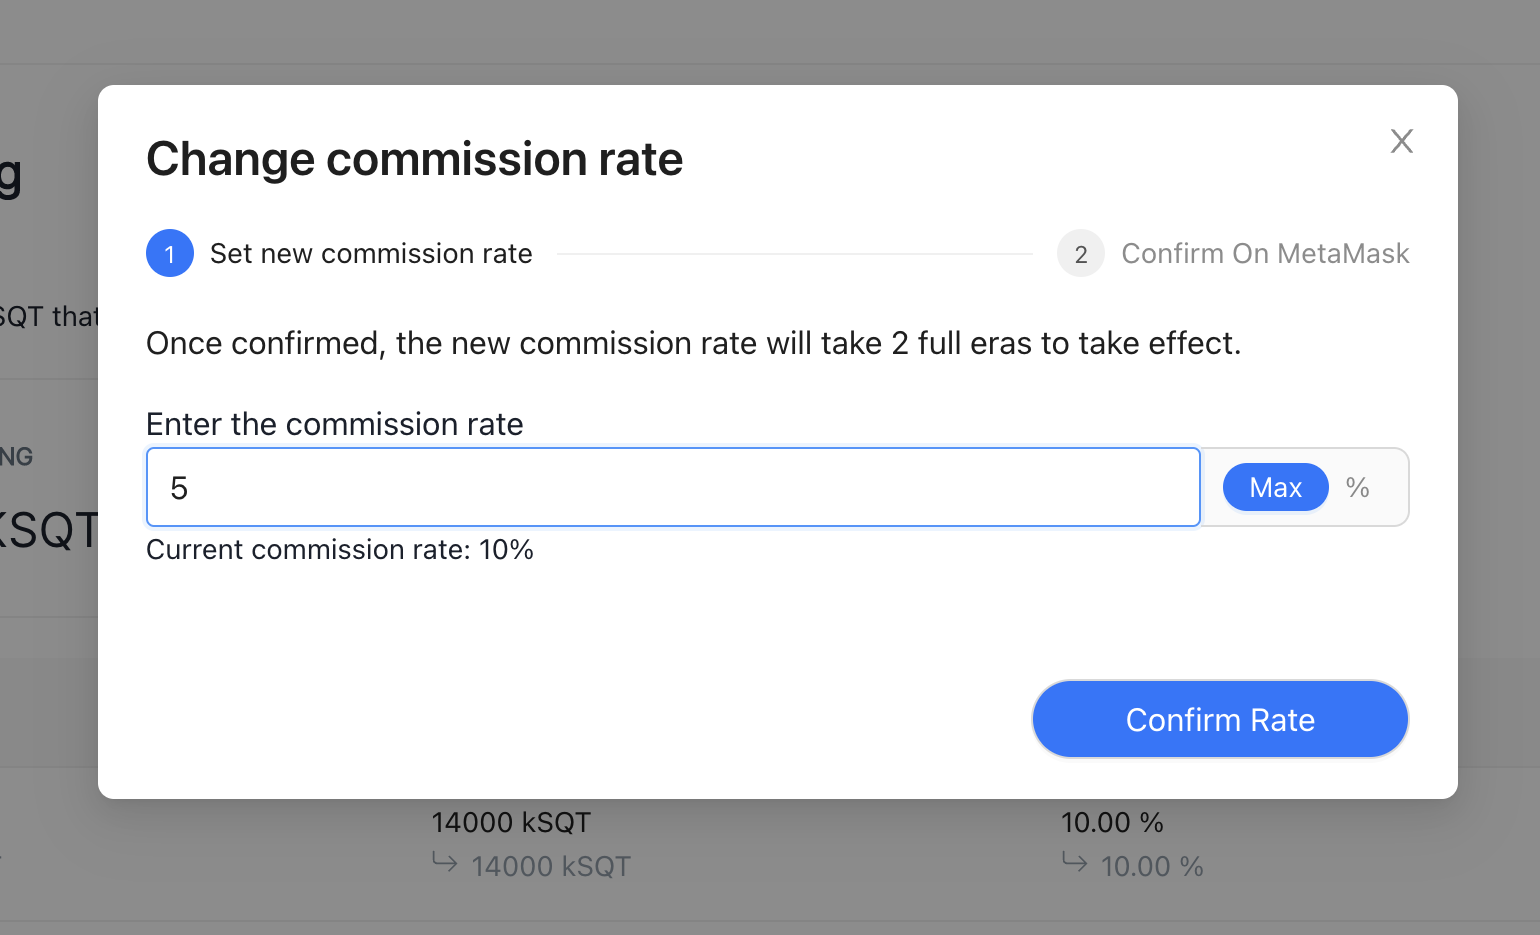
Changes will come into effect at the start of the next Era.
7. Allocate your SQT stake to start receiving rewards
You must actively allocate or assign your staked and delegated SQT to certain projects you run in order to receive rewards. Unallocated SQT is essentially wasted.
We suggest you check this page at the start of each Era, and make sure you are keeping on top to maximise allocated SQT, and also allocate SQT to more profitable projects (e.g. ones with a higer APY). Find out how here.
We also highly recommend that you enable Auto Reduce Over Allocation to prevent being over allocated.
8. Troubleshooting and FAQs
Visit Troubleshooting or FAQs if you run into technical issues.
9. Setting up a Grafana Dashboard (Optional)
This guide will walk you through setting up a preconfigured Grafana Dashboard to view metrics from the indexer-coordinator and indexer-proxy.
Backup your Docker Compose
Make a backup of your existing docker-compose.yaml file (in the Node Operator services folder) before proceeding with Grafana setup.
We will automatically pull and overwrite your version with the latest
Navigate to the directory where your docker-compose.yml file is located (this will be referred to as indexer-services-folder) and run the command
cd indexer-services-folder
# Note the next step will overwrite your existing docker-compose.yml, make sure you have a backup
mkdir network-indexer-services-temp && curl -L https://api.github.com/repos/subquery/network-indexer-services/tarball/main | tar -xzf - --strip-components=1 -C ./network-indexer-services-temp && rm -rf ./ipfs ./metrics && mv ./network-indexer-services-temp/deploy/* . && rm -rf ./network-indexer-services-temp
This will generate a folder named metrics containing all the necessary setup files for your Dashboard.
Before using the docker-compose file in the metrics directory, you should port over your previous changes from your backup that you created earlier, and make several additional modifications:
- Open the
docker-compose-metrics.ymlfile and update theGF_SECURITY_ADMIN_PASSWORDvariable. This is the password you'll use to log in to the Grafana dashboard. - Navigate to
metrics/datasources/datasource.ymland update the Authorization token. It should match the--metrics-tokenspecified in the proxy container section of yourdocker-compose.ymlfile. - In the
metrics/prometheus.ymlfile, update thebearer_token. It should also match the--metrics-tokenvalue, but in the format ofBearer <metrics-token-here>. - If your
indexer-proxyruns on a non-default port, update the target underquery_count -> static_configs -> targetsin themetrics/prometheus.ymlfile.
For Linux Users
If you are running your Node Operator services on linux you need specify the exact ip instead of host.docker.internal inside metrics/prometheus.yml file.
You can get this for indexer-proxy and indexer-coordinator by running:
docker inspect -f '{{range .NetworkSettings.Networks}}{{.IPAddress}}{{end}}' <container_name>
After doing this configuration you can start up the compose file:
docker-compose -f ./metrics/docker-compose-metrics.yml up -dHead to http://<indexer-endpoint>:3000, your username will be admin and password will be whatever you set for GF_SECURITY_ADMIN_PASSWORD
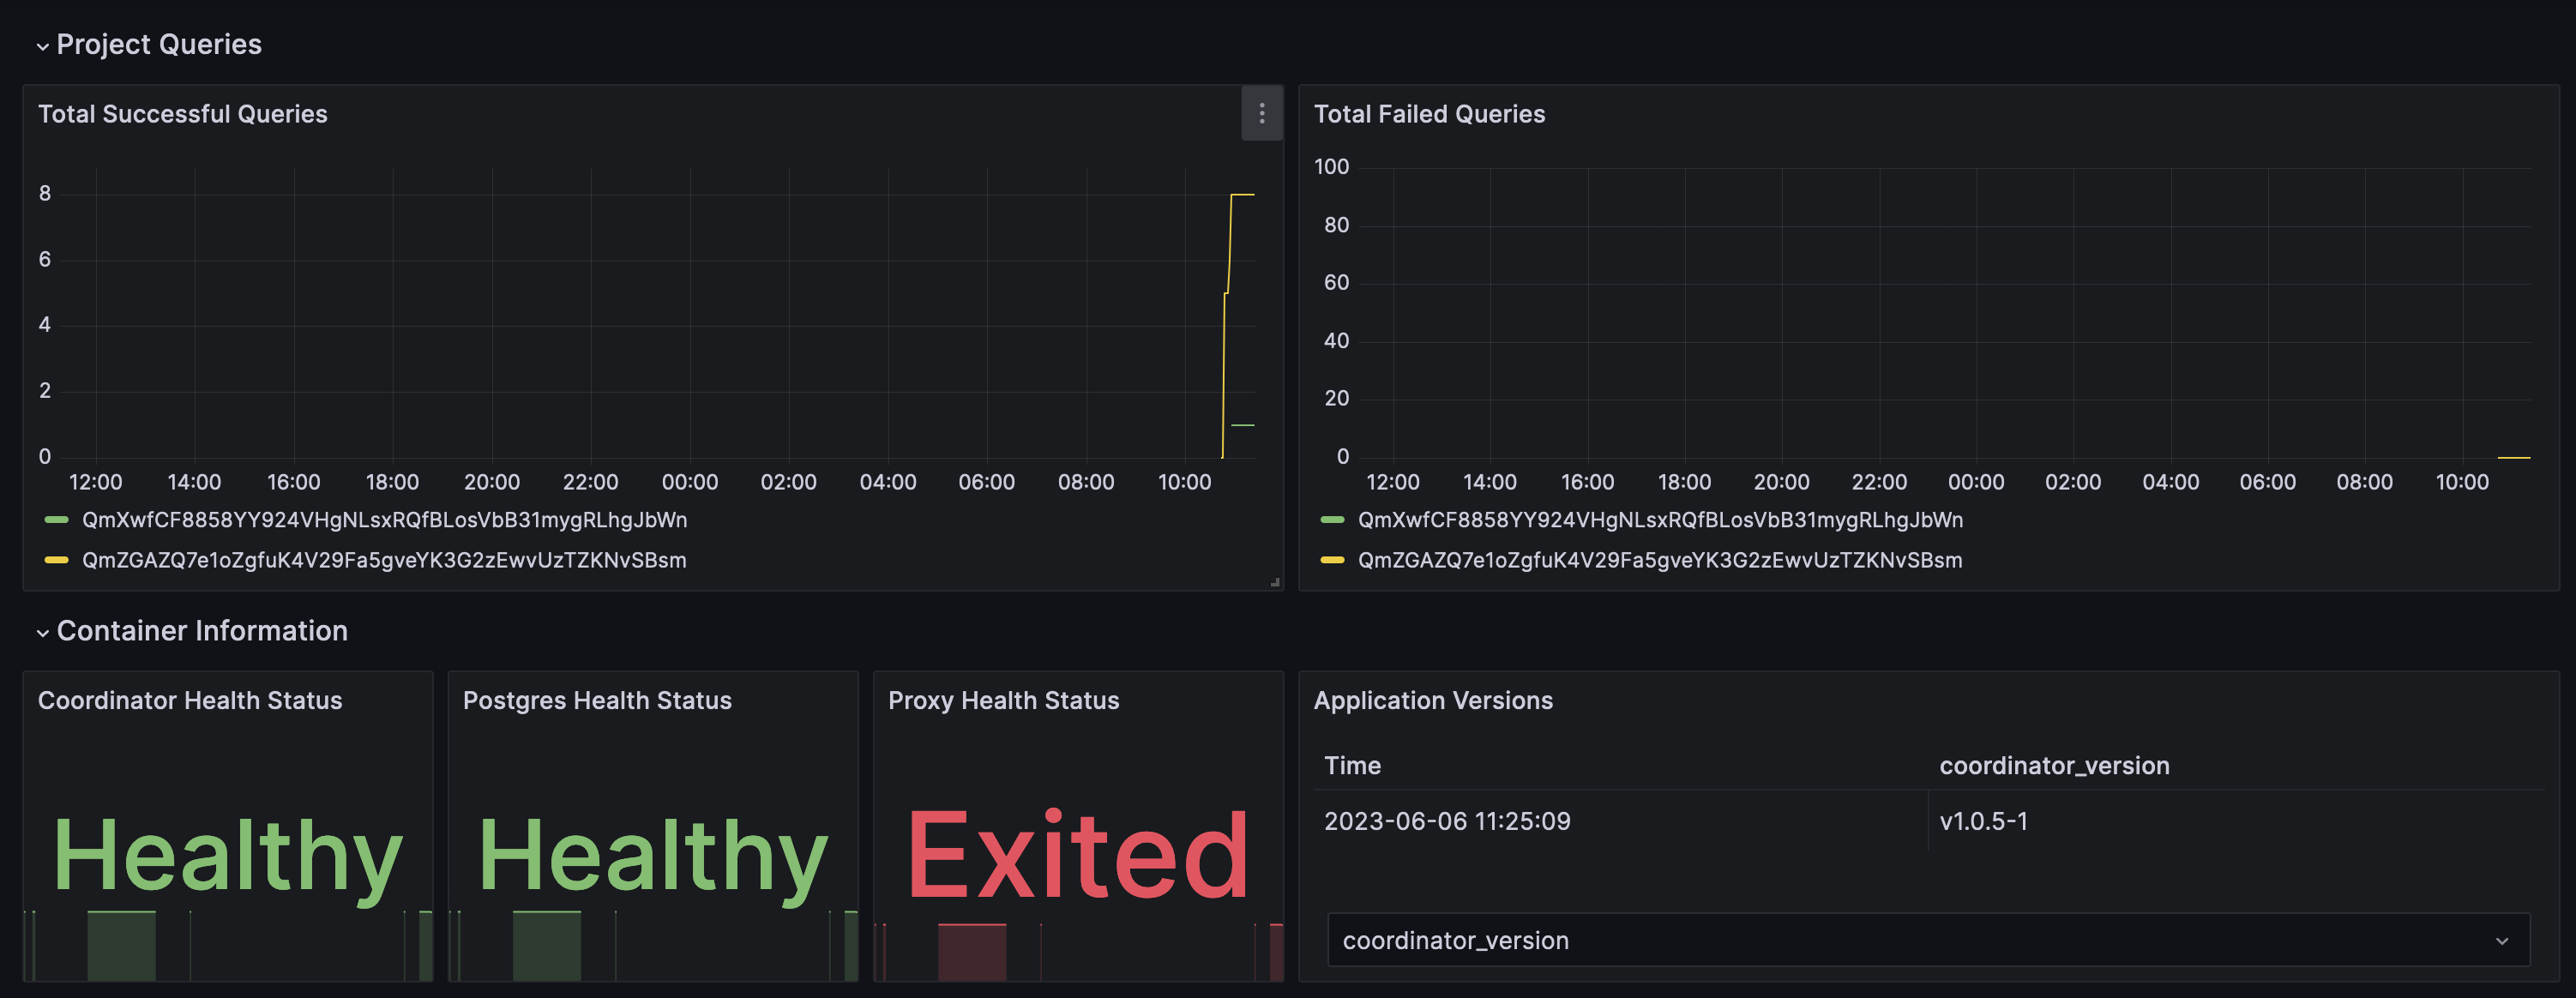
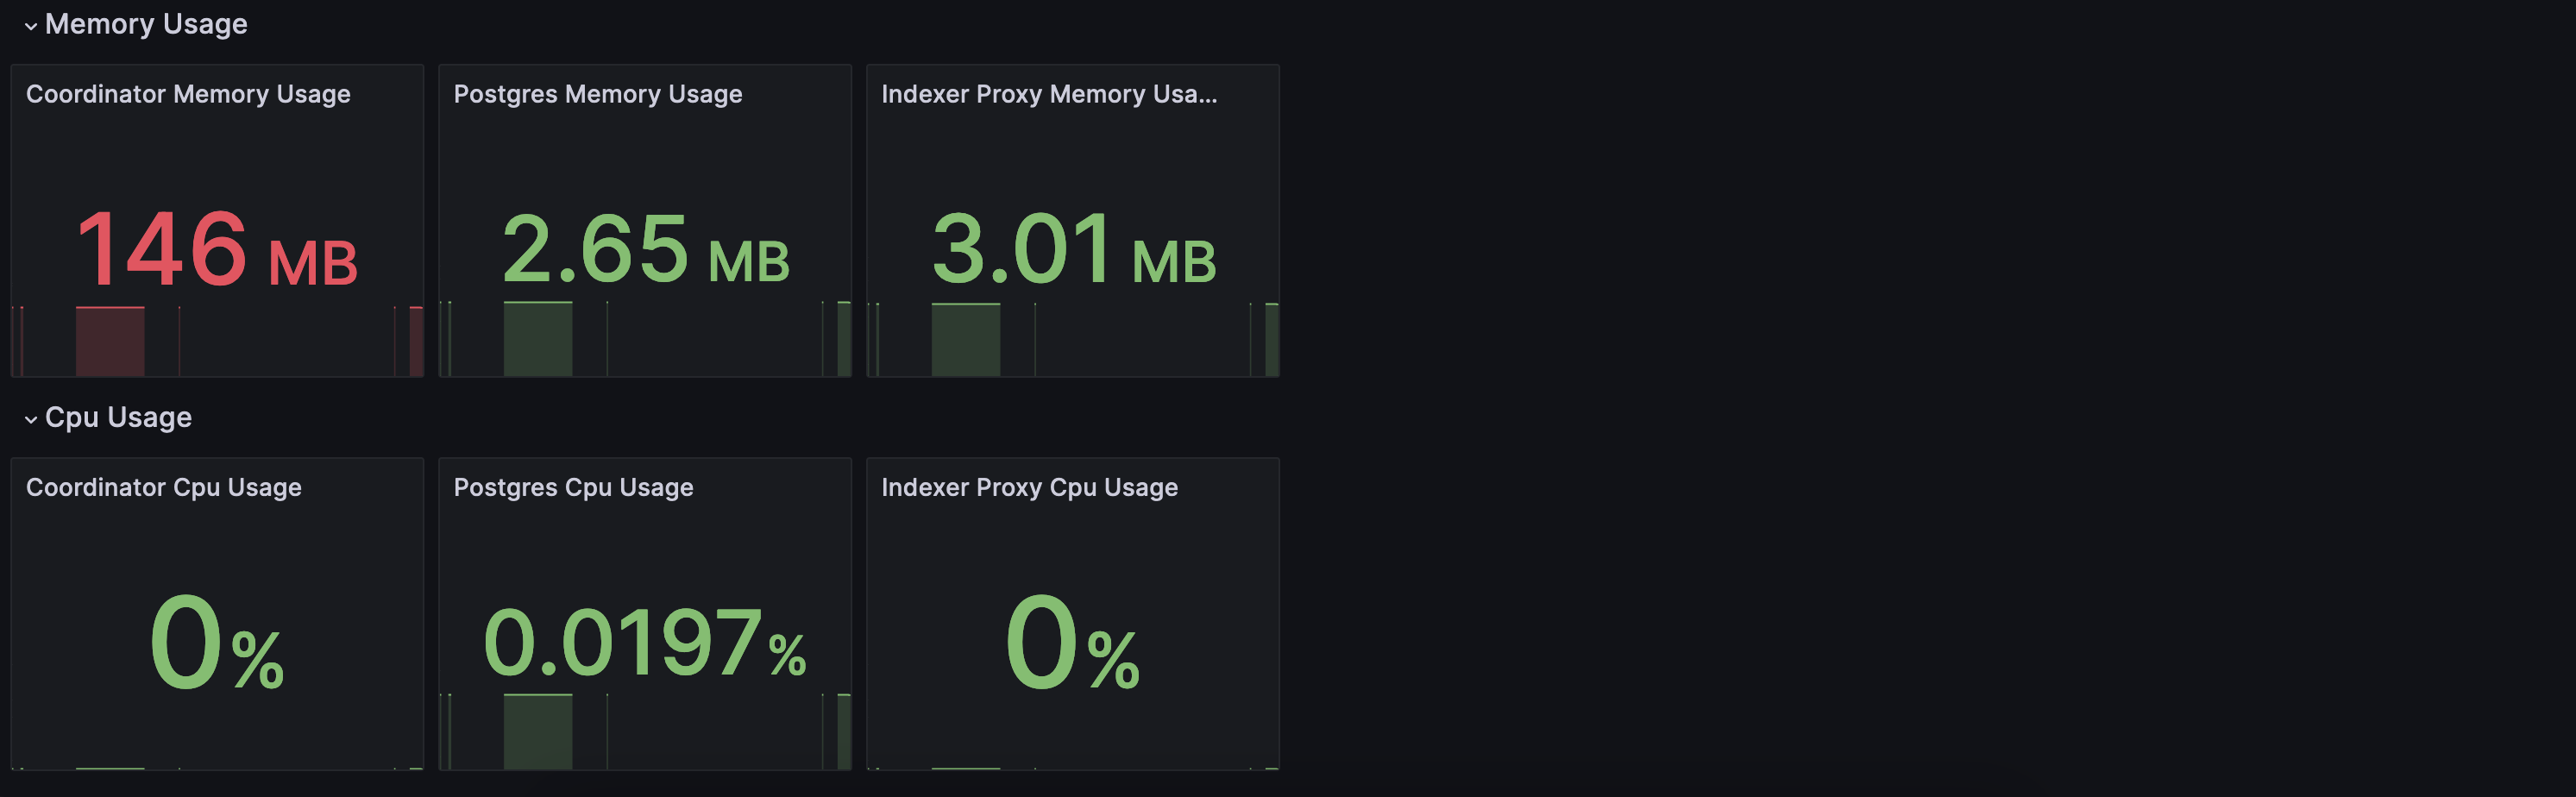
Once you have successfully logged in, look for 'dashboards' on the left-hand side of the screen. Under the 'general' section, you will find a dashboard that looks like this:
10. Auto-Upgrading Docker Compose
Step 1: Download the auto-upgrade-tool.sh Script
Use the following command to download the auto-upgrade-tool.sh script:
curl https://raw.githubusercontent.com/subquery/network-indexer-services/main/deploy/auto-upgrade-tool.sh -o auto-upgrade-tool.sh
chmod +x auto-upgrade-tool.sh
Step 2: Usage of auto-upgrade-tool.sh
The auto-upgrade-tool.sh script automatically fetches the latest tags for subquerynetwork/indexer-coordinator and subquerynetwork/indexer-proxy from Docker Hub and updates the versions in your Docker Compose configuration file.
# Default usage with `docker-compose.yml`
./auto-upgrade-tool.sh

# Specify a custom Docker Compose file
./auto-upgrade-tool.sh -f my-compose.yml

# Force the script to run `docker compose up` without confirmation
./auto-upgrade-tool.sh -y
Here’s an example of running the script:
./auto-upgrade-tool.sh
Latest coordinator tag: v2.10.0
Latest proxy tag: v2.9.0
📦 Backup created: docker-compose.yml.20250429_180911.bak
✅ Coordinator tag updated to v2.10.0.
🎉 docker-compose.yml has been updated to the latest tags.
Do you want to run 'docker compose up'? (yes/[no]): yes
🔄 Pulling latest images:
    Command    : docker compose pull
    Config file: docker-compose.yml
WARN[0000] /Users/a/company_info/network-indexer-services/deploy/docker-compose.yml: the attribute `version` is obsolete, it will be ignored, please remove it to avoid potential confusion
[+] Pulling 5/5
 ✔ redis Pulled                                                                     4.6s
 ✔ ipfs Pulled                                                                      2.9s
 ✔ proxy Pulled                                                                     2.9s
 ✔ coordinator Pulled                                                               4.3s
 ✔ postgres Pulled                                                                  4.2s
🔄 Starting services:
    Command    : docker compose up -d
    Config file: docker-compose.yml
WARN[0000] /Users/a/company_info/network-indexer-services/deploy/docker-compose.yml: the attribute `version` is obsolete, it will be ignored, please remove it to avoid potential confusion
WARN[0000] A network with the name `indexer_services` exists but was not created for project "deploy".
Set `external: true` to use an existing network.
[+] Running 5/5
 ✔ Container indexer_cache        Started                                           0.4s
 ✔ Container indexer_db           Healthy                                           5.9s
 ✔ Container indexer_ipfs         Healthy                                           5.9s
 ✔ Container indexer_coordinator  Healthy                                          11.5s
 ✔ Container indexer_proxy        Started                                          11.6s
After running the script, the docker-compose.yml file will be updated. Below is an example of the changes:
# git diff docker-compose.yml

Δ deploy/docker-compose.yml
─────────────────────────────────────────────────────────────────────────────────────────
────────────────┐
• 18: services: │
────────────────┘
 18 ⋮ 18 │      retries: 5
 19 ⋮ 19 │
 20 ⋮ 20 │  coordinator:
-21 ⋮ 21 │    image: subquerynetwork/indexer-coordinator:v2.9.1
+21 ⋮ 21 │    image: subquerynetwork/indexer-coordinator:v2.10.0
 22 ⋮ 22 │    container_name: indexer_coordinator
 23 ⋮ 23 │    restart: always
 24 ⋮ 24 │    ports:
Step 3: Set Up a Cron Job
To automate the script execution, set up a cron job. Below is an example of a cron job that runs the script every 6 hours:
0 */6 * * * /path/to/auto-upgrade-tool.sh -y -f /path/to/docker-compose.yml >> /var/log/auto-upgrade-cron.log 2>&1This will log the output to /var/log/auto-upgrade-cron.log for future reference.
Adding the Cron Job with sudo
To add the cron job as a superuser, use the following command:
sudo crontab -eThis will open the cron editor for the root user. Add the following line to schedule the script:
0 */6 * * * /path/to/auto-upgrade-tool.sh -y -f /path/to/docker-compose.yml >> /var/log/auto-upgrade-cron.log 2>&1Save and exit the editor to apply the changes.
By following these simple steps, you can upgrade your Node Operator services in Docker Compose and ensure that they are running the latest version of the image.